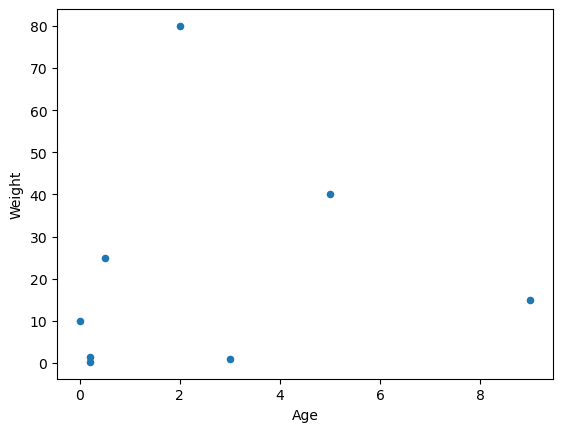
Scatter Plot
df.plot(kind='scatter', x=data_col, y=data_col)
Creates a scatter plot using a DataFrame.
- Input:
- kind : string
- To create a scatter plot, use kind='scatter'
- x : label
- Column for horizontal coordinates of each point.
- y : label
- Column for vertical coordinates of each point..
- Returns:
- Matplotlib plot created using parameters.
- Return Type:
- Matplotlib plot
pets.plot(kind='scatter', x='Age', y='Weight')
See Also
[Line Plot](../plotting/Line Plot.md) · [Bar Plot](../plotting/Bar Plot.md)
Problems or suggestions about this page? Fill out our feedback form.